
Inventory optimization AI is a network-aware system of models that sets stock levels, reorder points, and allocation rules to minimize total inventory while holding or improving service levels. Instead of managing each SKU-location pair in isolation, it treats the supply network as one connected system. The result, based on published research and vendor case data, typically includes measurable inventory reduction, fewer stockouts, and freed-up working capital, covered below alongside the methods, data, and rollout steps that make it work.
TL;DR:
- Multi-echelon AI inventory optimization reduces total inventory by strategically placing safety stock at fewer, upstream nodes instead of managing each SKU-location independently.
- Deep reinforcement learning models outperform classical methods by up to 16.4% in controlled environments, especially in dynamic or complex multi-node networks.
- Effective implementation requires careful data integration, validation against historical demand, and phased rollout over multiple seasonal cycles to ensure reliable ROI.
- Top KPIs for measuring success include inventory levels, service rate improvements, stockout reductions, forecast accuracy, and working capital savings.
- Ongoing tuning and cross-functional alignment are essential, as results depend on continuous governance and model explainability beyond initial deployment.
Table of Contents
- What Does AI Inventory Optimization Actually Do?
- Core AI Techniques and Model Choices
- Multi-Echelon vs Local SKU-Location Optimization: Which Matters More?
- How Do You Implement AI Inventory Optimization?
- What Data and Systems Does AI Inventory Optimization Need?
- How Do You Measure the ROI of AI Inventory Optimization?
- Merkium's Approach to Research-Backed Inventory Optimization
- What Practitioners Get Wrong About AI Inventory Projects
- Get Started With AI-Driven Inventory Optimization
- Sources
- FAQ
What Does AI Inventory Optimization Actually Do?
At its core, this technology automates decisions that used to sit in a planner's spreadsheet: how much safety stock to hold, when to trigger a reorder, how big that order should be, and where inventory should physically sit across a network of warehouses and stores. The system balances two competing goals, cost and service, and increasingly runs multi-objective setups that also weigh cash flow, carbon footprint, or supplier risk.
The automated decisions usually fall into three buckets:
- Safety stock calibration — setting buffer levels per SKU-location based on demand variability and lead-time uncertainty, not a flat multiplier.
- Reorder point and quantity optimization — triggering replenishment at the moment total cost (holding plus stockout risk) is minimized.
- Cross-node allocation — deciding which distribution center or store gets scarce inventory first when supply is constrained.
Core AI Techniques and Model Choices
Not every inventory problem needs the same tool, and picking the wrong one wastes both budget and trust in the system.
Time-series machine learning (gradient boosting, LSTMs) handles demand forecasting well when patterns are seasonal or trend-driven and history is clean. For many retailers, an upgraded forecasting layer alone closes most of the gap between current performance and target service levels.
Deep reinforcement learning (DRL) earns its place when the environment is dynamic: perishables, substitution effects, or networks where reorder decisions ripple across multiple nodes. A DRL approach using Proximal Policy Optimization (PPO) applied to multi-echelon inventory systems showed performance improvements of 6.6% to 16.4% over traditional benchmark inventory control methods across varied network structures.
Statistic Callout: DRL-based inventory policies beat classical benchmarks by up to 16.4% in controlled multi-echelon studies, though these gains require longer training and validation cycles than a simple forecasting model.
Graph and relational models capture demand cascades and substitution links across nodes, which flat, single-table forecasting misses entirely. Industry benchmarks from graph-based platforms show notably higher location-level accuracy scores than traditional tabular approaches, though results vary by network complexity.
Stochastic and mixed-integer programming (MILP) approaches shine during disruption planning, where the real question is whether to hold protection inventory or pay for expediting. Research on multi-stage disruption modeling shows the optimal answer depends on disruption probability and cost ratios, not a fixed rule of thumb.
Whichever technique you deploy, insist on explainability and confidence scores attached to every recommendation. A reorder suggestion without a visible reason code will get overridden by planners the first time it looks wrong, and adoption dies quietly from there.
Multi-Echelon vs Local SKU-Location Optimization: Which Matters More?
Local optimization, tuning each SKU-location independently, feels intuitive but tends to backfire at scale. Every node builds its own safety buffer against uncertainty, and those buffers stack up across the network without actually improving overall protection. Supply chain researchers at MIT describe this as a version of the bullwhip effect: treating the network as disconnected nodes inflates total system inventory even as individual locations look well-managed.
Multi-echelon inventory optimization instead models the network as one connected graph. It strategically places protection inventory at fewer, better-positioned points, often upstream distribution centers rather than every downstream store, and lets those points absorb variability for the nodes they serve. The trade-off is complexity: multi-echelon models need more data, more compute, and more organizational buy-in to trust a recommendation that might look counterintuitive at the local level ("why is this store carrying less safety stock than last quarter?").

If your network has more than two tiers, shared suppliers across regions, or SKUs that substitute for each other, the network-level approach is worth the added complexity.
How Do You Implement AI Inventory Optimization?
Rolling this out well is less about the algorithm and more about sequencing. Skip a step here and the pilot either fails to prove value or, worse, "succeeds" on bad data and gets scaled into a mess.
- Assess and prioritize. Segment SKUs and echelons by revenue impact and data readiness. Start where the payoff is highest and the data is cleanest, not where the loudest stakeholder complains.
- Design the pilot. Set clear objectives, a holdout group of SKUs or regions that stay on the old process, a realistic timeline (typically 8 to 12 weeks for initial signal), and specific acceptance criteria before you start.
- Integrate the data feeds. Connect ERP, MRP, WMS, and POS systems, and fix master-data issues (duplicate SKU codes, missing lead-time fields) before the model ever sees the data.
- Validate rigorously. Backtest against historical demand, run counterfactual comparisons against the old policy, and require human approval on early recommendations with visible explainability output.
- Roll out in phases. Expand by category or region, update standard operating procedures, build exception workflows for edge cases, and set a monitoring cadence, weekly at first, monthly once stable.
Pro Tip: Run your pilot's holdout group for a full seasonal cycle if your business has one. A four-week pilot during a flat demand period will show flattering numbers that evaporate the first time demand swings.
What Data and Systems Does AI Inventory Optimization Need?
Model quality is a data problem before it's an algorithm problem. IBM's overview of AI inventory management notes that clean, connected data, daily demand history, per-location inventory positions, and supplier lead-time distributions, are the baseline requirement for training a usable multi-echelon model.
The essential feeds typically include:
- Daily or weekly demand history at the SKU-location level, not aggregated regionally.
- Real-time inventory positions across every node in the network.
- Supplier lead-time distributions, not single average figures. Lead-time variance drives safety stock far more than average lead time does.
- Shipment and Advance Ship Notice (ASN) data to track in-transit inventory accurately.
- Product metadata and substitution links (which SKUs can stand in for each other).
Lead-time variance is the pitfall most teams underestimate. A supplier averaging 10 days with a 2-day standard deviation needs a very different buffer than one averaging 10 days with an 8-day swing, even though the averages look identical on a dashboard. Build an audit trail for every model recommendation from day one; it's what makes explainability credible when a planner questions a decision six months into production.
How Do You Measure the ROI of AI Inventory Optimization?
Track these core KPIs before and after deployment:
- Days of inventory (DOI) and carrying cost as a percentage of inventory value.
- Fill rate / service level, measured per SKU-location, not just company-wide.
- Stockout frequency and its downstream effect on lost sales.
- Forecast accuracy (MAPE) to isolate whether gains come from better forecasting or better policy logic.
- Working capital freed, the metric finance teams actually care about.
Statistic Callout: Commercial deployments commonly report inventory reductions in the 10% to 35% range with service-level gains of roughly 1 to 3 percentage points, figures that track with the pattern in Gartner's research on AI adoption in supply chains, which found top-performing supply chain organizations use AI to optimize processes at more than twice the rate of low-performing peers.
Use SKU or regional holdouts with pre/post comparisons adjusted for seasonality, and expect the first credible ROI signal within one to two full seasonal cycles, not the first month.
Merkium's Approach to Research-Backed Inventory Optimization
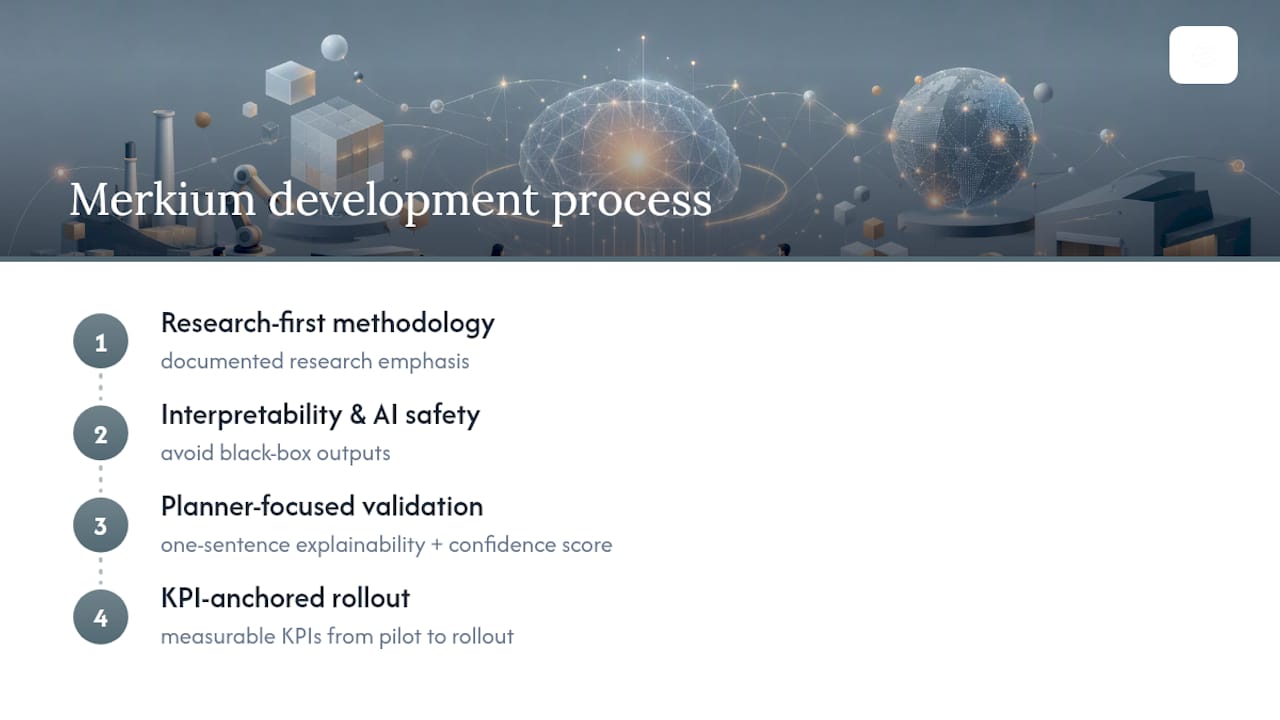
Merkium builds AI models around a research-first methodology, with a documented emphasis on model interpretability and AI safety practices rather than opaque black-box outputs. Every deployment we've scoped for logistics clients starts with the same question a supply chain director would ask: can this recommendation be explained to a planner in one sentence, and does it come with a confidence score attached? That discipline shapes how Merkium's model development process is structured, and it's why measurable KPIs, not just algorithmic sophistication, anchor every engagement from pilot through rollout.
What Practitioners Get Wrong About AI Inventory Projects
AI inventory optimization is iterative work, not a switch you flip. Expect ongoing tuning, governance reviews, and reward-function adjustments for months after go-live, not weeks. The most common trap is optimizing SKU-locations independently and calling it "AI driven," which inflates total system buffers instead of shrinking them. Get data engineering and cross-functional alignment right before the model ever runs. If a forecasting upgrade alone would close your service-level gap, skip the network-level investment; save it for genuinely multi-echelon problems.
— afonso
Get Started With AI-Driven Inventory Optimization
Custom AI models are built for logistics and supply chain teams who need more than a forecasting dashboard, specifically network-aware systems that account for lead-time variance, substitution effects, and multi-echelon trade-offs from day one.

A typical engagement starts with a scoped pilot: defined KPIs, a realistic timeline built around your seasonal cycle, and governance deliverables that include explainability documentation for every model recommendation, not just accuracy scores. That research-driven foundation is detailed on Merkium's research page, and our approach to model transparency and AI safety shapes every deployment we run. If your network has outgrown spreadsheet-based reorder rules, the next step is a scoping conversation about which SKUs and echelons would benefit most from a pilot. Reach out through Merkium to start that conversation.
Sources
The UTwente DRL study quantifies reinforcement learning gains; Gartner's release tracks adoption trends; the systematic literature review surveys AI method prevalence; and the disruption-expediting trade-off paper models protection inventory decisions.
- Multi-echelon inventory optimization using deep reinforcement learning (UTwente)
- Gartner press release on AI adoption in supply chains
- Multi-stage inventory positioning with disruption-expediting trade-offs (DOI)
FAQ
Can AI Do Inventory Management?
Yes. AI systems already automate demand forecasting, safety stock calibration, and reorder decisions across multi-node networks, with published research showing measurable gains over traditional rule-based methods.
What Is Inventory Optimization?
Inventory optimization is the practice of setting stock levels, reorder points, and allocation rules to minimize total holding and stockout costs while meeting target service levels, ideally across the whole network rather than one location at a time.
What Is the 80/20 Rule in Inventory?
The 80/20 rule (Pareto principle) holds that roughly 80% of inventory value or demand typically comes from about 20% of SKUs, which is why most AI optimization projects prioritize that top SKU segment first during pilot design.
How Can ChatGPT Be Used for Inventory Management?
General-purpose chat AI can help summarize demand trends, draft reorder reports, or explain model outputs in plain language, but it isn't a substitute for a purpose-built forecasting or multi-echelon optimization model trained on your actual inventory data.